Creating effective data tables is crucial for presenting information clearly and efficiently. Whether you're displaying data on a website, in a report, or within an application, well-designed tables enhance user experience and facilitate data analysis. This guide outlines key principles for designing user-friendly and effective data tables.
1. Understand the Purpose and User Needs
Before diving into design, it's essential to understand the table's purpose and the needs of its users. This involves asking key questions:
- Who are the users: (e.g., analysts, customers, administrators) Knowing your audience helps tailor the table to their specific needs and technical proficiency.
- What data will be displayed: (e.g., financial data, sales records, customer feedback) Different data types require different formatting and presentation strategies.
- What will users do with the data: (e.g., view, edit, filter, export) Understanding user tasks determines the necessary functionalities, such as sorting, filtering, and pagination.
2. Data Type Considerations
Different data types require specific formatting for optimal readability and comprehension:
- Text Data: Ensure sufficient column width to prevent text truncation. Use clear and concise labels.
- Numeric Data: Right-align numbers for easy comparison. Use appropriate formatting (e.g., commas, decimals, currency symbols).
- Mixed Data (Text, Numbers, Icons): Balance visual elements to avoid clutter. Consider using tooltips or hover effects to provide additional information without overwhelming the table.
3. User Interaction and Workflow
Design tables to support user workflow and objectives:
- Viewing vs. Editing: For editable tables, provide clear interaction points (e.g., inline editing, checkboxes, dropdowns).
- Comparisons: Ensure consistent alignment and spacing for easy side-by-side comparison of data.
- Filtering and Sorting: Implement intuitive filtering and sorting options for efficient data exploration.
4. Visual Hierarchy and Layout
Establish a clear visual hierarchy to guide users’ attention:
- Headers: Use distinct styling (e.g., bold font, different background color) to make headers easily identifiable.
- Cell Structure: Prioritize key data by making it visually prominent.
- Whitespace and Alignment: Use sufficient whitespace to prevent overcrowding. Left-align text and right-align numbers for optimal readability.

5. Scalability and Responsiveness
Plan for scalability to accommodate growing datasets:
- Pagination: Implement pagination to break large datasets into manageable chunks.
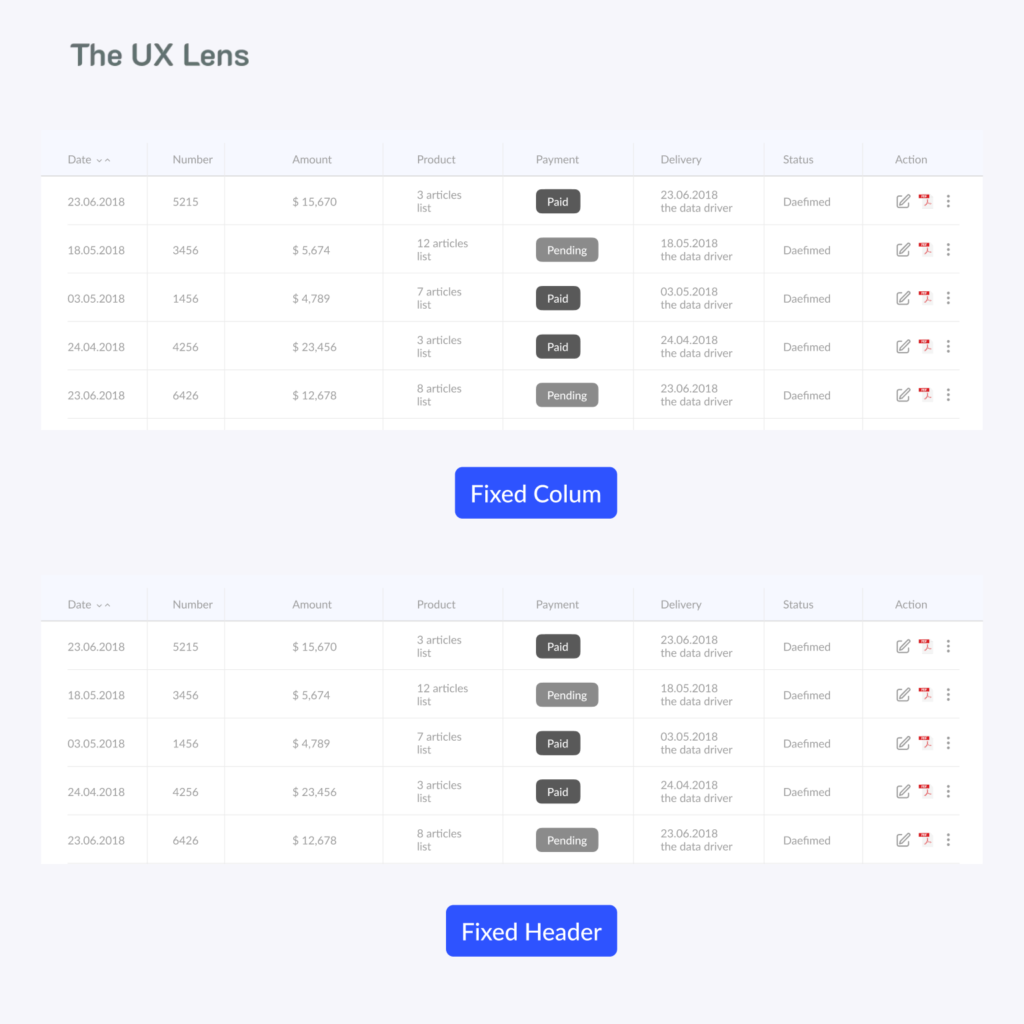
- Column Freezing: Freeze key columns (e.g., IDs, names) for easy reference when scrolling horizontally.
- Sticky Headers: Keep headers visible when scrolling vertically in long tables.
- Responsive Design: Ensure the table adapts well to different screen sizes and devices (desktops, tablets, mobile phones).
6. Prioritize Usability and Accessibility
Prioritize usability and accessibility for all users:
- Sorting and Filtering: Provide clear and intuitive sorting and filtering options.
- Accessibility: Adhere to accessibility guidelines (WCAG) to ensure the table is usable by people with disabilities (e.g., provide proper ARIA attributes, sufficient color contrast).
- Clear Instructions/Tooltips: Provide clear instructions or tooltips where necessary to explain complex functionalities or data points.
Key Takeaways for SEO and User Experience:
- Clear and concise language: Use simple, easy-to-understand terms.
- Structured content: Use headings, subheadings, and bullet points to break up text and improve readability.
- Keywords: Use relevant keywords throughout the content to improve search engine optimization (e.g., “data table design,” “table usability,” “responsive tables”).
- Mobile-friendliness: Ensure the content is accessible and readable on mobile devices.
- Visual appeal: Use images and examples to illustrate key concepts and make the content more engaging.
By following these principles, you can create data tables that are not only functional but also user-friendly, accessible, and effective in conveying information.